Part 3. Seasonal Adjustment
Step by Step Guide: How to Apply Transforms
Seasonal adjustment is a statistical technique used to remove the effects of seasonal factors from a time series dataset.
Make sure you have at least two years of data and no missing data. Five years are recommended for better results!
01. Fetch Alphacast Dataset.
In the example, the Brazilian exports and imports data were used to create a chart. Notice that the January and February data were usually lower than the rest of the year due to seasonality. This effect can occur due to factors such as weather conditions, holidays, and business cycles.
To remove the seasonal data from a time serie dataset you can use a transformation called "Seasonal Adjustment"
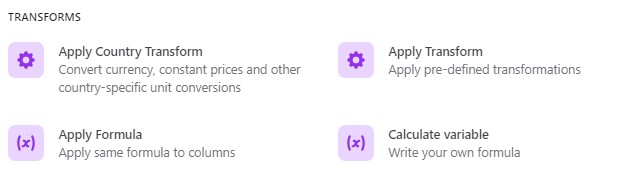
02. Add the "Apply Transform" step
03. Select "Seasonally Adjusted" on the drop-down menu and which variable you want to transform.

You can observe the new series is less noisy than the original and the summer contractions are no longer there.

Rolling Sum & Percentage of GDP
Also, you can transform the data to see how much it represents in terms of GDP by calculating a 12-month rolling sum.
-
Add the "Calculate Variable" step with the "rollingsum" formula, selecting exports and twelve months.

-
Change the unit to share of GDP using the "Apply Country Trasform" step, select on the drop-down menu "share of US Dollar GDP" and picking Brazil as the country value.

-
Create a chart using the variable "12 months USD GDP" and click save.

Click here (opens in a new tab) to visit this pipeline
Congratulations! You have completed the Intermediate Level Learning Path.
Move on to the advanced level Learning path to discover more charting and pipeline features.
Good luck with your learning path!